
Maximize Your Trading Potential Join Our Community
Connect with experienced traders and gain insights to enhance your trading strategies.
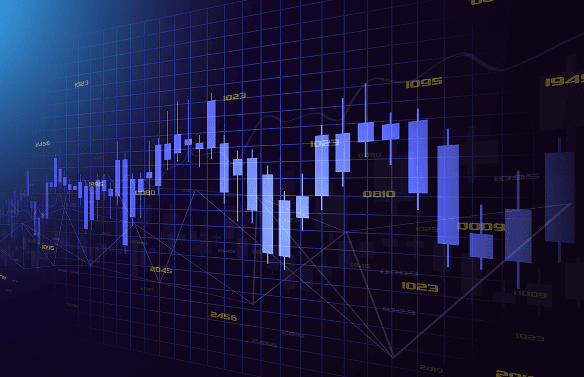
Technical Indicators: The Trader's Secret Weapons
Technical indicators are essential tools used by traders to analyze market data, identify profitable opportunities, and make informed trading decisions. These indicators—such as Moving Averages, RSI, MACD, and Bollinger Bands—help predict price direction, detect momentum, and signal potential trend reversals. By studying these patterns, traders can minimize emotional trading and rely on data-driven insights. Whether in binary options, forex, or crypto trading, mastering technical indicators provides a strategic edge, improves accuracy, and enhances consistency. In short, they act as the secret weapons that turn ordinary traders into smart, confident market analyst
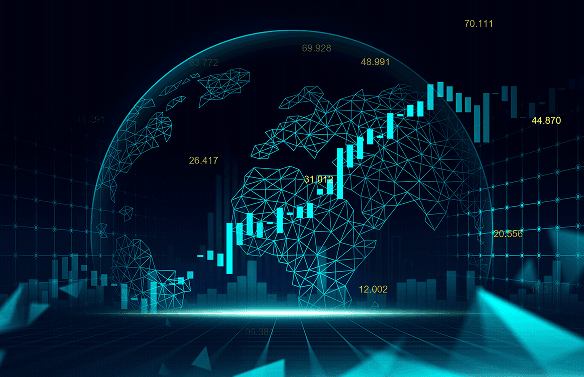
Candlestick Patterns: Decoding Market Sentiment
Candlestick patterns are visual tools that reveal the psychology behind price movements and market sentiment. Each candle tells a story of buyers and sellers—who's in control and where the market might head next. Patterns like Doji, Hammer, Engulfing, and Shooting Star help traders identify reversals, continuations, and potential breakout points. By mastering candlestick analysis, traders can interpret emotions such as fear and greed reflected in price action. It's a powerful technique that transforms charts into clear signals, helping traders make smarter, more confident trading decisions.
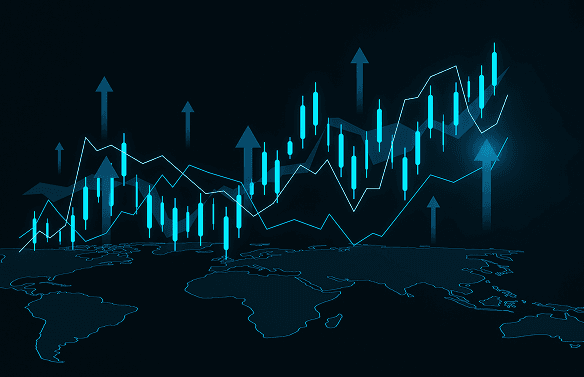
Support & Resistance: The Market's Turning Points
Support and resistance are key concepts in technical analysis that help traders identify potential turning points in the market. Support is a price level where buying pressure is strong enough to prevent the price from falling further, often acting as a "floor." Resistance is the opposite—a price level where selling pressure halts upward movement, acting as a "ceiling." Traders use these levels to anticipate price reversals or breakouts, set entry and exit points, and manage risk. Recognizing support and resistance improves timing for trades and helps understand market psychology and trend strength.
EUR/USD
Real-time price chart • Enhanced visibility for small movements